バックナンバーはこちら。
https://www.simulationroom999.com/blog/compare-matlabpythonscilabjulia3-backnumber/

はじめに
Hysteresis Thresholdについての解説を行う回。
登場人物
博識フクロウのフクさん

イラストACにて公開の「kino_k」さんのイラストを使用しています。
https://www.ac-illust.com/main/profile.php?id=iKciwKA9&area=1
エンジニア歴8年の太郎くん

イラストACにて公開の「しのみ」さんのイラストを使用しています。
https://www.ac-illust.com/main/profile.php?id=uCKphAW2&area=1
Hysteresis Thresholdの雰囲気
今回は、Hysteresis Thresholdを解説してくれるんだよね?
そうそう。
ところで、センサー情報で「ヒス付きで判定」というもの知っているだろうか?
そういうえば、High、Lowを確定させるのに、LowからHigh、HighからLowに移行する際の閾値を変えるようなやつがあるね。
考え方としては、Hysteresis Thresholdはそれと一緒だ。
もしかして「ヒス付き」のヒスってHysteresisの略だったり?
そうそう。
なるほど。
ちょっとやりたいことが見えてきた気がするぞ。
Hysteresis Thresholdを図解
では、今回のHysteresis Thresholdを図解しよう。
実線が残るデータで、破線は消えるデータだな。
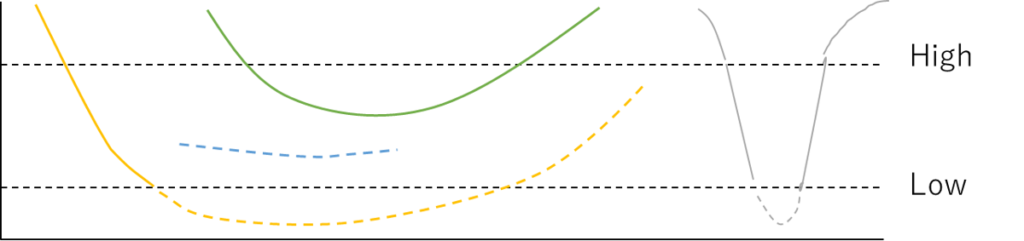
雰囲気的にはセンサー情報に対するヒス付き判定と同じ見えるが・・・。
センサー情報は、横軸が時間で、判定も一個前との比較程度ですむんだけど、
画像の場合は、平面であり、しかも判定も1方向にならない。
今回の図も、左から右方向の判定以外に、右から左方向の判定が入っている。
そうか・・・。
平面上での信号の繋がりを判定するから、センサー情報のヒス付きと全く同じというわけにはいかないのか・・・。
これは判定が複雑になりそうな気がする・・・。
判定の方法としては、以下になる。
- High以上は白
- Low未満は黒
- High-Lowの間の場合は周辺を探査し、エッジが居れば白、いなければ黒
ちなみにここで言っているエッジは、強制的に白判定にしたものになる。
High以上で白になったものもあれば、探査の結果として白になったものもあるが、
両方ともエッジとして解釈する。
そうすると、High以上の線と繋がっている線が残るようになって、
その結果として欲しい線だけが残る傾向が強くなるってことか。
そうそう。
まとめ
まとめだよ。
- Hysteresis Thresholdの雰囲気をセンサ情報のヒス付き判定と関連させて説明。
- Hysteresis Thresholdを図解で説明。
- Hysteresis Thresholdの具体的な判定方法を説明。
バックナンバーはこちら。


コメント