バックナンバーはこちら。
https://www.simulationroom999.com/blog/compare-matlabpythonscilabjulia2-backnumber/
はじめに
正規方程式を導出するまでの説明。
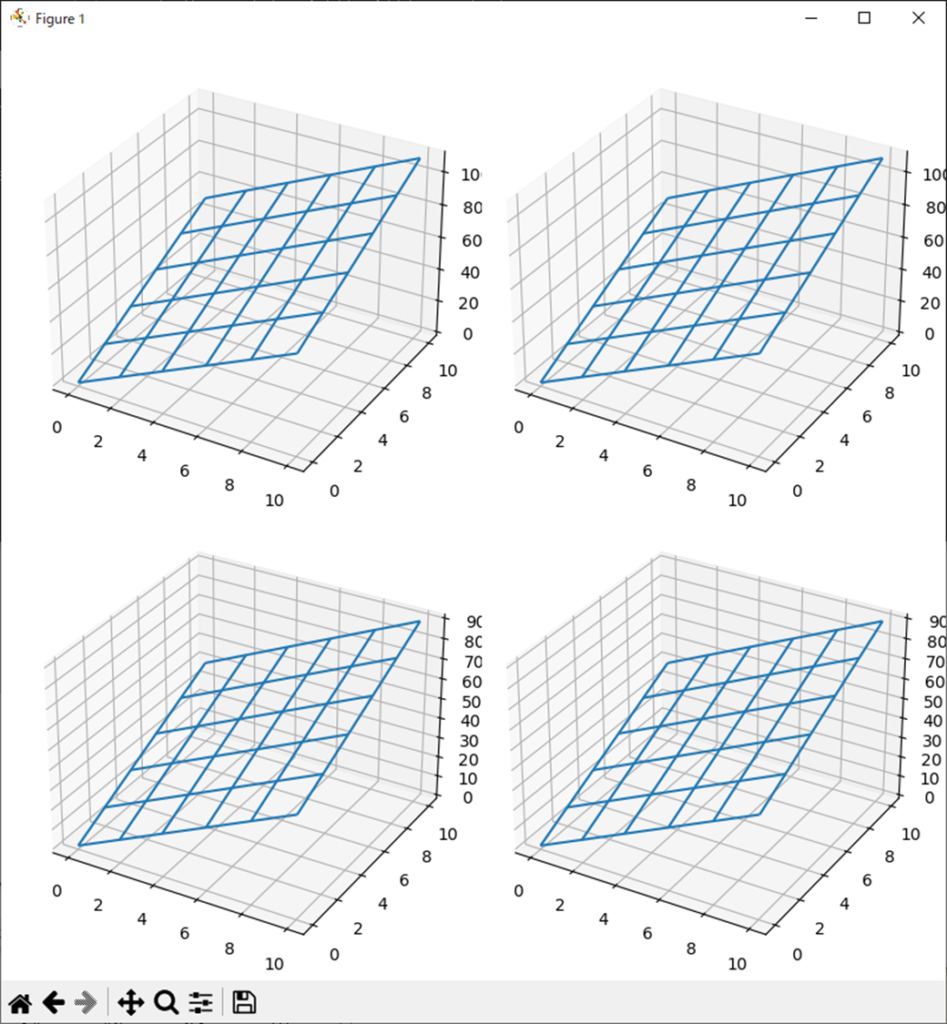
今回は二次形式の微分(勾配)を実際の多項式に適用したものをJuliaで算出&プロットしてみる。
登場人物
博識フクロウのフクさん

イラストACにて公開の「kino_k」さんのイラストを使用しています。
https://www.ac-illust.com/main/profile.php?id=iKciwKA9&area=1
エンジニア歴8年の太郎くん

イラストACにて公開の「しのみ」さんのイラストを使用しています。
https://www.ac-illust.com/main/profile.php?id=uCKphAW2&area=1
ロードマップ&数式【再掲】

まずは恒例のロードマップと数式を再掲。

二次形式の多項式
\(
f(x,y)=3x^2+2y^2+5xy
\)
二次形式の多項式の偏導関数
\(
\displaystyle\frac{\partial f(x,y)}{\partial x}=6x+5y
\)
\(
\displaystyle\frac{\partial f(x,y)}{\partial y}=4y+5x
\)
二次形式の行列形式の偏導関数
\(
\nabla f(x,y) =
\begin{bmatrix}
\displaystyle\frac{\partial f(x,y)}{\partial x} \\
\displaystyle\frac{\partial f(x,y)}{\partial y}
\end{bmatrix}=
2AX=2
\begin{bmatrix}
3 & 5/2 \\
5/2 & 2
\end{bmatrix}
\begin{bmatrix}
x \\
y
\end{bmatrix}
\)

今回はJuliaで算出してみる。
Juliaコード

Juliaコードは以下になる。
using PyPlot

function meshgrid(xin,yin)
	nx=length(xin)
	ny=length(yin)
	xout=zeros(ny,nx)
	yout=zeros(ny,nx)
	for jx=1:nx
	    for ix=1:ny
	        xout[ix,jx]=xin[jx]
	        yout[ix,jx]=yin[ix]
	    end
	end
	return (x=xout, y=yout)
end

a=3;
b=2;
c=5;
A=[a c/2; c/2 b];

N=6;
ax=range(0,10,length=N);
ay=range(0,10,length=N);
x,y=meshgrid(ax,ay);

fig, (ax1, ax2, ax3, ax4) = plt.subplots(2, 2,
	figsize=(8, 8),
	subplot_kw=Dict("projection" => "3d"))

polyY1=6*x+5*y;
polyY2=5*x+4*y;
ax1.plot_wireframe(x, y, polyY1);
ax2.plot_wireframe(x, y, polyY2);

X=[x[:]';y[:]'];
Y=2*A*X;
matY1=reshape(Y[1,:],N,N);
matY2=reshape(Y[2,:],N,N);

ax3.plot_wireframe(x, y, matY1);
ax4.plot_wireframe(x, y, matY2);

plt.tight_layout()
plt.show()

polyY1
polyY2
matY1
matY2
処理結果

そして処理結果。

julia> polyY1
6×6 Matrix{Float64}:
  0.0  12.0  24.0  36.0  48.0   60.0
 10.0  22.0  34.0  46.0  58.0   70.0
 20.0  32.0  44.0  56.0  68.0   80.0
 30.0  42.0  54.0  66.0  78.0   90.0
 40.0  52.0  64.0  76.0  88.0  100.0
 50.0  62.0  74.0  86.0  98.0  110.0

julia> polyY2
6×6 Matrix{Float64}:
  0.0  10.0  20.0  30.0  40.0  50.0
  8.0  18.0  28.0  38.0  48.0  58.0
 16.0  26.0  36.0  46.0  56.0  66.0
 24.0  34.0  44.0  54.0  64.0  74.0
 32.0  42.0  52.0  62.0  72.0  82.0
 40.0  50.0  60.0  70.0  80.0  90.0

julia> matY1
6×6 Matrix{Float64}:
  0.0  12.0  24.0  36.0  48.0   60.0
 10.0  22.0  34.0  46.0  58.0   70.0
 20.0  32.0  44.0  56.0  68.0   80.0
 30.0  42.0  54.0  66.0  78.0   90.0
 40.0  52.0  64.0  76.0  88.0  100.0
 50.0  62.0  74.0  86.0  98.0  110.0

julia> matY2
6×6 Matrix{Float64}:
  0.0  10.0  20.0  30.0  40.0  50.0
  8.0  18.0  28.0  38.0  48.0  58.0
 16.0  26.0  36.0  46.0  56.0  66.0
 24.0  34.0  44.0  54.0  64.0  74.0
 32.0  42.0  52.0  62.0  72.0  82.0
 40.0  50.0  60.0  70.0  80.0  90.0
考察

これも結果としてはMATLABと同じく完全一致か。

コード自体は演算部分はMATLABと同一だな。
グラフ表示がPyPlot経由のMatplotlibの仕様になっているという差がある程度だな。
あとは、meshgrid関数がJuliaには存在しないので、自作関数を入れ込んでいてる。
まとめ

まとめだよ。
- 二次形式の多項式としての偏導関数、行列形式による偏導関数を元にJuliaで算出及びプロット。
- ともに同一の算出結果とプロットが得られた。
- コードの差は演算部分はmeshgridを自作、グラフ表示がPyPlot経由Matplotlibの仕様になってる程度。
バックナンバーはこちら。


コメント