
バックナンバーはこちら。
https://www.simulationroom999.com/blog/compare-matlabpythonscilabjulia-backnumber/
はじめに
前回はpythonによる波形表示。
基本的にはmatplotlibを使用する。
matplotlibはMATLAB仕様に合わせこんでくれているのでかなり助かっている。
今回は、これのScilabの話。
登場人物
博識フクロウのフクさん

イラストACにて公開の「kino_k」さんのイラストを使用しています。
https://www.ac-illust.com/main/profile.php?id=iKciwKA9&area=1
エンジニア歴8年の太郎くん

イラストACにて公開の「しのみ」さんのイラストを使用しています。
https://www.ac-illust.com/main/profile.php?id=uCKphAW2&area=1
Scilabの場合
太郎くん
次はScilabになるのかな?
フクさん
Scilabは・・・ぶっちゃけMATLABと一緒だな。
太郎くん
あ、そこら辺も合わせこんでくれてる感じなのか。
フクさん
まぁ同じようにざっと確認してみよう。
波形表示
フクさん
波形表示は以下。
ちなみにpiが%piになってる点に注意だ。
-->x=linspace(0,2*%pi,200);

-->plot(x,sin(x),'--r');

-->plot(x,cos(x),'-.b');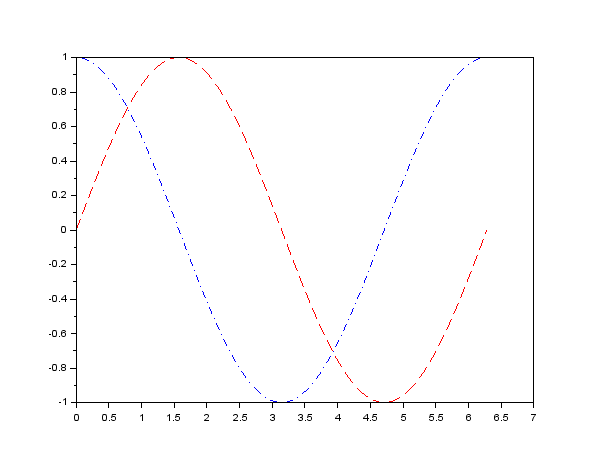
太郎くん
確かにMATLABと一緒だ。
波形表示(複数グラフ)
フクさん
複数グラフもMATLABと一緒だな。
subplotを使用する。
-->x=linspace(0,2*%pi,200);

-->subplot(2,3,1)

-->plot(x,sin(x),'--r');

-->subplot(2,3,2)

-->plot(x,cos(x),'-.b');

-->subplot(2,3,3)

-->plot(x,sin(x),'--r');

-->subplot(2,3,4)

-->plot(x,cos(x),'-.b');

-->subplot(2,3,5)

-->plot(x,sin(x),'--r');

-->subplot(2,3,6)

-->plot(x,cos(x),'-.b');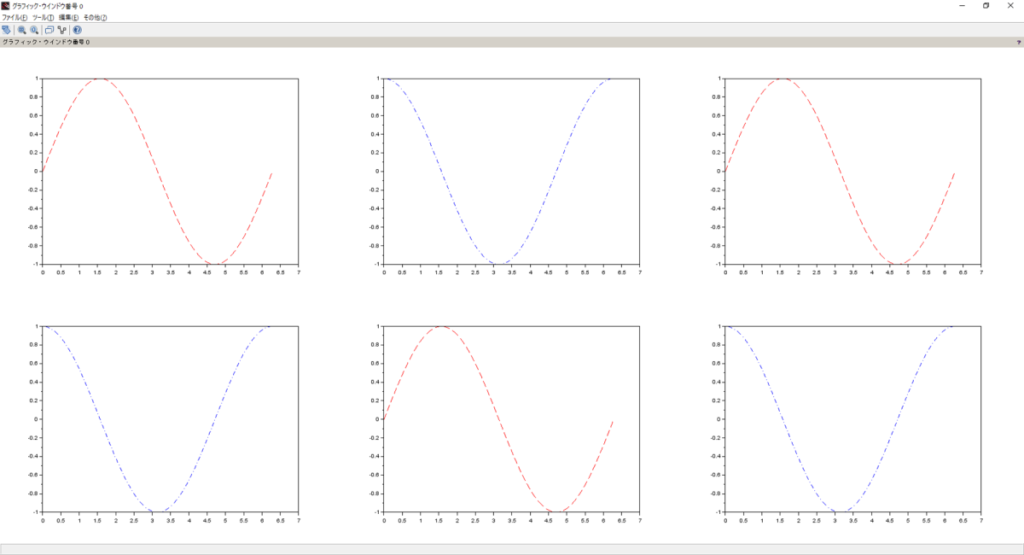
太郎くん
ここまで一緒とは・・・。
ラインスタイル
フクさん
ラインスタイルも一緒だな。
| 指定子 | 線種 |
|---|---|
| ‘-‘ | 実線 (既定の設定) |
| ‘–‘ | 破線 |
| ‘:’ | 点線 |
| ‘-.’ | 一点鎖線 |
色指定
太郎くん
色指定も一緒っぽい
| 指定子 | 色 |
|---|---|
| r | 赤 |
| g | 緑 |
| b | 青 |
| c | シアン |
| m | マゼンタ |
| y | 黄色 |
| k | 黒 |
| w | 白 |
マーカ指定
フクさん
マーカ指定も一緒だ。
| 指定子 | マーカタイプ |
|---|---|
| + | プラス記号 |
| o | 円 |
| * | アスタリスク |
| . | 点 |
| x | 十字 |
| ‘square’ or ‘s’ | 四角 |
| ‘diamond’ or ‘d’ | ひし形 |
| ^ | 上向きの三角形 |
| v | 下向きの三角形 |
| > | 右向きの三角形 |
| < | 左向きの三角形 |
| ‘pentagram’ | 星型五角形 (ペンタグラム) |
| ‘none’ | マーカなし (デフォルト) |
太郎くん
ホント一緒過ぎて、確認する意味あったのかってレベルだなぁ。
フクさん
まぁ一緒である事実を知っておくのも重要ってことだ。
といっても特殊はグラフ表示も多いから突き詰めると結構乖離するが、
このシリーズでは乖離しないようにやって行く予定だ。
まとめ
フクさん
- Scilabの波形表示はMATLABと同一。
- 特殊なグラフ表示は乖離する可能性が高いが、そこまで複雑使い方はしない予定。
バックナンバーはこちら。


コメント