はじめに
先日、Pythonで実現した、「LAF(全領域空燃比)センサ特性同定」のMATLAB版。
内容の詳細説明はこちら。
https://www.simulationroom999.com/blog/python-laf-sensor-characteristic/
MATLAB,Python,Scilab比較記事はこちら。
https://www.simulationroom999.com/blog/comparison-of-matlab-python-scilab/
本記事はPythonと同じような手法ができるそうかの確認のみとなる。
無条件に2次関数に同定
実験コード
function test_fullpolyfit()
    x = [0.51, 0.76, 1.06, 1.41, 1.75, 1.9, 2.01, 2.15, 2.27, 2.4, 2.49, 2.59, 2.67, 2.76, 2.83, 2.89, 2.95, 3.01, 3.05, 3.11, 3.15, 3.19, 3.23, 3.28, 3.31, 3.34, 3.38, 3.4, 3.43, 3.46, 3.49, 3.51];
    y = [10, 11, 12, 13, 14, 14.5, 15, 16, 17, 18, 19, 20, 21, 22, 23, 24, 25, 26, 27, 28, 29, 30, 31, 32, 33, 34, 35, 36, 37, 38, 39, 40];

    coef = polyfit(x, y, 2);	% 最小二乗法で得られた2次関数の各係数
    disp('各係数:');
    disp(coef);

    xp = linspace(0, 4, 400);	% 同定した2次関数のx軸を生成
    quad_func = polyval(coef,xp);	% 2次関数の各係数から2次関数を生成

    hold on
    plot(x, y, '+', ...
	xp, quad_func, '-k' );

    ylim([10,41]);
    xlim([0,4]);
出力結果
各係数:
    4.8952  -11.3244   17.0939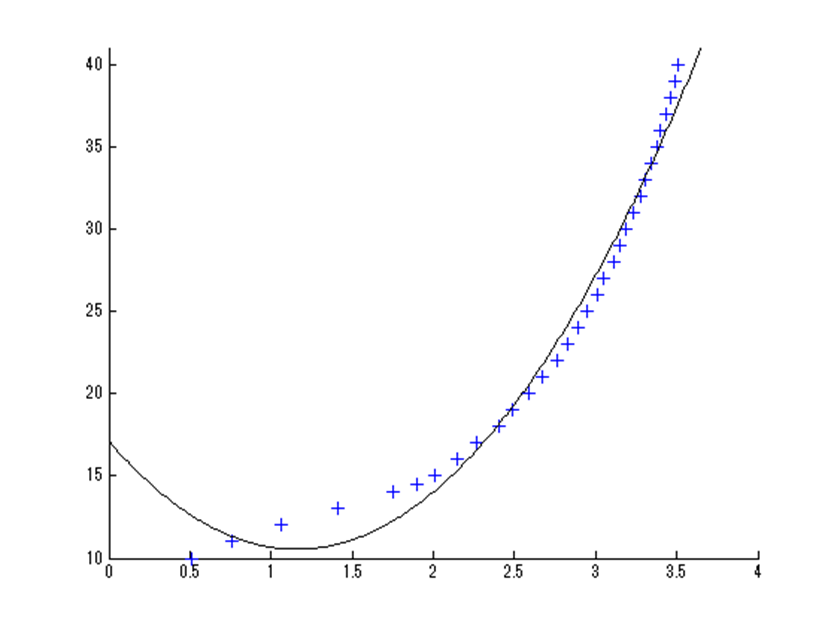
$$4.8952x^2-11.3244x+17.0939$$
Pythonの時と同様の結果。
4区間分割で同定
実験コード
function test_fullpolyfit2()
    x = [0.51, 0.76, 1.06, 1.41, 1.75, 1.9, 2.01, 2.15, 2.27, 2.4, 2.49, 2.59, 2.67, 2.76, 2.83, 2.89, 2.95, 3.01, 3.05, 3.11, 3.15, 3.19, 3.23, 3.28, 3.31, 3.34, 3.38, 3.4, 3.43, 3.46, 3.49, 3.51];
    y = [10, 11, 12, 13, 14, 14.5, 15, 16, 17, 18, 19, 20, 21, 22, 23, 24, 25, 26, 27, 28, 29, 30, 31, 32, 33, 34, 35, 36, 37, 38, 39, 40];

    xp = linspace(0, 4, 400);	% 同定した2次関数のx軸を生成

    %第1区間
    x1=x(1:6);
    y1=y(1:6);

    coef1 = polyfit(x1, y1, 2);	% 最小二乗法で得られた2次関数の各係数
    disp('第1区間各係数:');
    disp(coef1);

    quad_func1 = polyval(coef1,xp);	% 2次関数の各係数から2次関数を生成

    %第2区間
    x2=x(6:13);
    y2=y(6:13);

    coef2 = polyfit(x2, y2, 2);	% 最小二乗法で得られた2次関数の各係数
    disp('第2区間各係数:');
    disp(coef2);

    quad_func2 = polyval(coef2,xp);	% 2次関数の各係数から2次関数を生成

    %第3区間
    x3=x(13:23);
    y3=y(13:23);

    coef3 = polyfit(x3, y3, 2);	% 最小二乗法で得られた2次関数の各係数
    disp('第3区間各係数:');
    disp(coef3);

    quad_func3 = polyval(coef3,xp);	% 2次関数の各係数から2次関数を生成

    %第4区間
    x4=x(23:32);
    y4=y(23:32);

    coef4 = polyfit(x4, y4, 2);	% 最小二乗法で得られた2次関数の各係数
    disp('第4区間各係数:');
    disp(coef4);

    quad_func4 = polyval(coef4,xp);	% 2次関数の各係数から2次関数を生成

    hold on
%    plot(x, y, '+', ...
%	xp, quad_func1, '-r', ...
%	xp, quad_func2, '-g', ...
%	xp, quad_func3, '-b', ...
%	xp, quad_func4, '-c', ...
%   'LineWidth',2 );

    plot(x, y, '+', ...
	xp(57:195), quad_func1(57:195), '-r', ...
	xp(195:269), quad_func2(195:269), '-g', ...
	xp(269:325), quad_func3(269:325), '-b', ...
	xp(325:353), quad_func4(325:353), '-c', ...
    'LineWidth',2 );

    ylim([10,41]);
    xlim([0,4]);
出力結果
第1区間各係数:
   -0.3732    4.0677    8.0674

第2区間各係数:
    4.5732  -12.4567   21.6291

第3区間各係数:
   12.9122  -58.3832   84.8231

第4区間各係数:
   29.3578 -165.5658  259.3910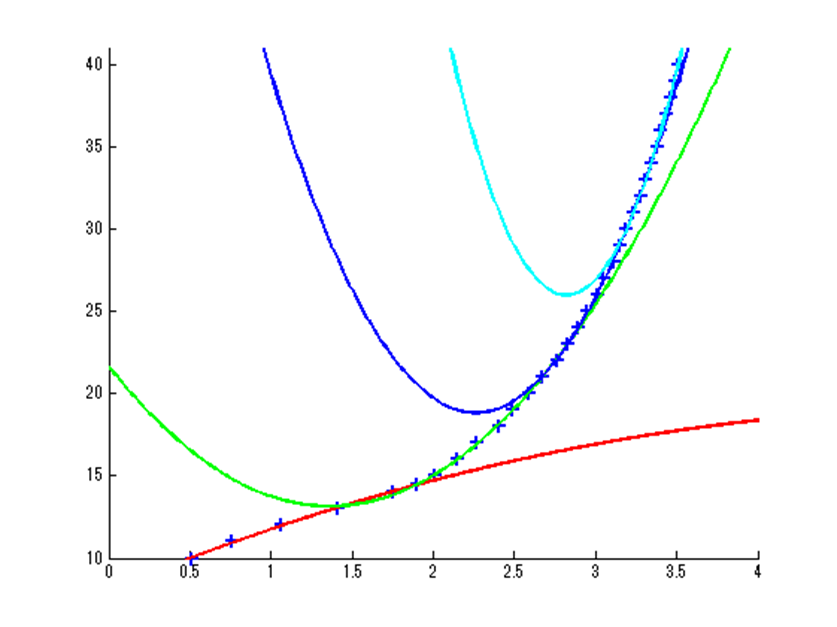
4区間分割で2次関数で同定
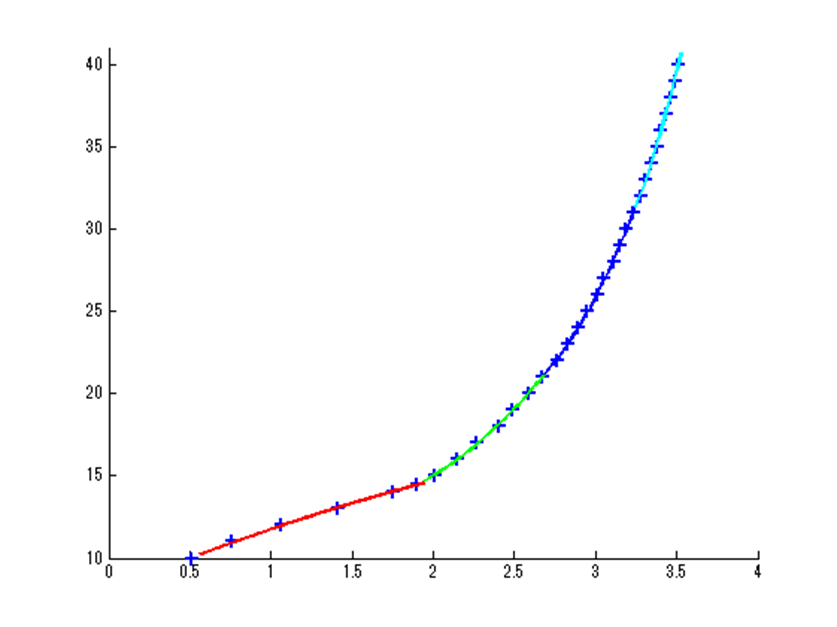
使用範囲だけ抽出。
第1区間:\(-0.3732x^2+4.0677x+8.0674\)
第2区間:\(4.5732x^2-12.4567x+21.6291\)
第3区間:\(12.9122x^2-58.3832x+84.8231\)
第4区間:\(29.3578x^2-165.5658x+259.3910\)
こちらは各関数を使用範囲に限定してプロットしたもの
こちらもPythonの時と同様の結果となる。
7次関数で同定
実験コード。
function test_fullpolyfit7()
    x = [0.51, 0.76, 1.06, 1.41, 1.75, 1.9, 2.01, 2.15, 2.27, 2.4, 2.49, 2.59, 2.67, 2.76, 2.83, 2.89, 2.95, 3.01, 3.05, 3.11, 3.15, 3.19, 3.23, 3.28, 3.31, 3.34, 3.38, 3.4, 3.43, 3.46, 3.49, 3.51];
    y = [10, 11, 12, 13, 14, 14.5, 15, 16, 17, 18, 19, 20, 21, 22, 23, 24, 25, 26, 27, 28, 29, 30, 31, 32, 33, 34, 35, 36, 37, 38, 39, 40];

    coef = polyfit(x, y, 7);	% 最小二乗法で得られた7次関数の各係数
    disp('各係数:');
    disp(coef);

    xp = linspace(0, 4, 400);	% 同定した7次関数のx軸を生成
    seven_func = polyval(coef,xp);	% 2次関数の各係数から7次関数を生成

    hold on
    plot(x, y, '+', ...
	xp, seven_func, '-k' );

    ylim([10,41]);
    xlim([0,4]);
出力結果
各係数:
   -0.0746    1.3987   -9.8992   35.1925  -66.7247   66.3076  -28.3120   13.9870
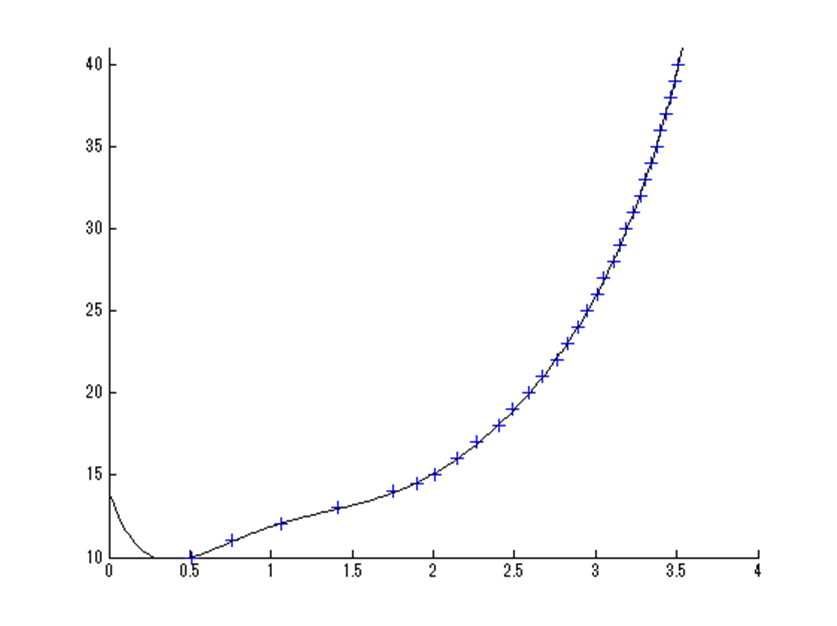
\(-0.0746x^7+1.3987x^6-9.8992x^5+35.1925x^4\)
\(-66.7247x^3+66.3076x^2-28.3120x+13.9870\)
またまたPythonの時と同様の結果。
まとめ
- Pythonと同様の結果(くどい)
- ただし、Pythonではpoly1dで多項式オブジェクトを生成していたが、MATLABではpolyvarで直接プロット用データを取得する。
※ Python版はこちら



コメント